Figure captions should be standalone, i.e., descriptive enough to be understood without having to refer to the main text. Effective captions typically include the following elements:
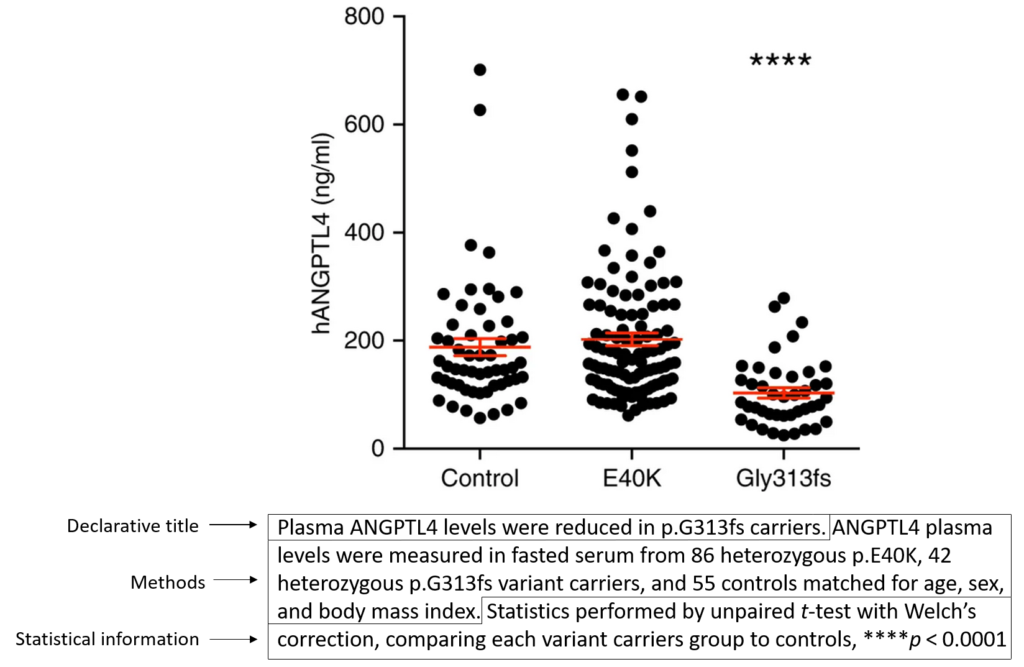
a declarative title that summarises the result or major finding of the data you are presenting in the figure;
a brief description of the methods necessary to understand the figure without having to refer to the main text;
statistical information, for example, number of replicates, asterisks denoting P-values, statistical tests, etc.
Example:
 [1].
[1].
A declarative title – will that bias the reader?
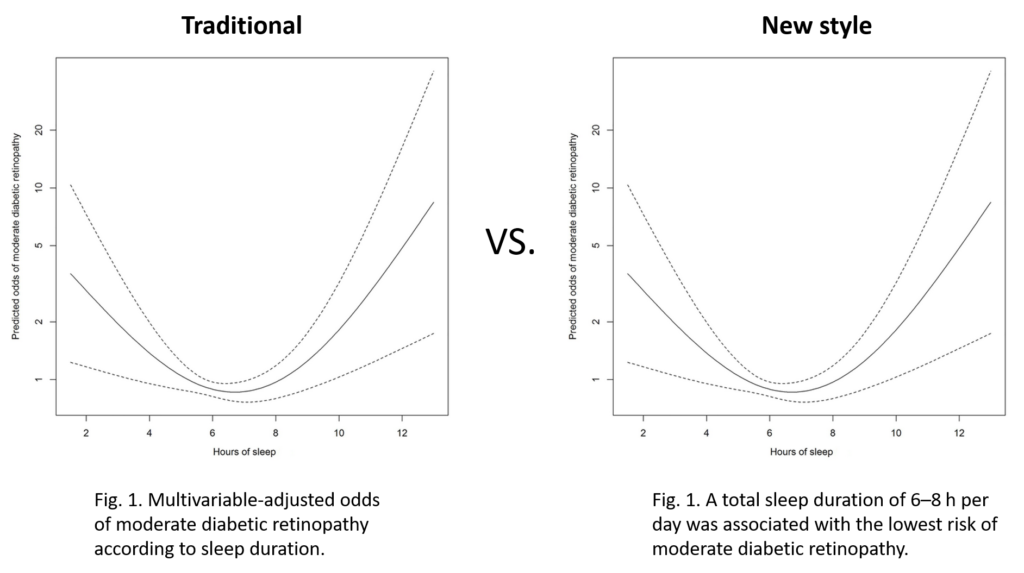
Traditionally, captions did not overtly state the main finding of the data being presented. Instead, a typical figure caption would only indicate the variables being discussed, for example, “Scatterplot showing the relationship between X and Y”. The onus was on the reader to draw their own conclusions from the figure. However, there has been a shift away from this style of caption in recent years (see below for a direct comparison of the different styles).
 [2].
[2].
This new style of figure caption offers a number of benefits. It helps the reader quickly grasp the author’s main take-home message. This should, in theory, entice the reader to read more of the text, i.e., if the reader quickly understands the main finding of the figure, they are likely to want to move on and build on the new knowledge. Writing in this style should also help focus the author at the construction stage, urging them to create figures that communicate their point most effectively. Finally, highly focused captions may prevent “data-dumps”, in which the author “dumps” data they cannot make sense of in the hope that someone else can [3].
You may be concerned, however, that a declarative title is not objective, i.e., it may bias the reader. However, it is likely you have already tailored your paper to present evidence for/against a hypothesis. Thus, in many ways, the whole paper is (acceptably) biased. Why state a conclusion overtly in the main text but hide it in the figures [3]?
Caption or legend?
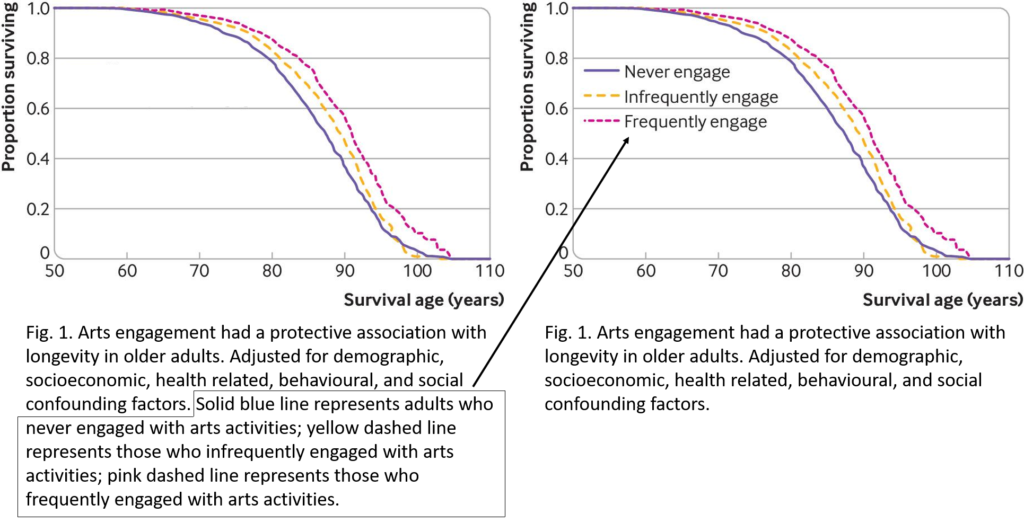
Ask yourself if there are elements in the figure caption that would be better served being included in a legend. In many cases, as with the following example, describing the figure elements in a legend is preferable.
 [4].
[4].
Scope of a figure
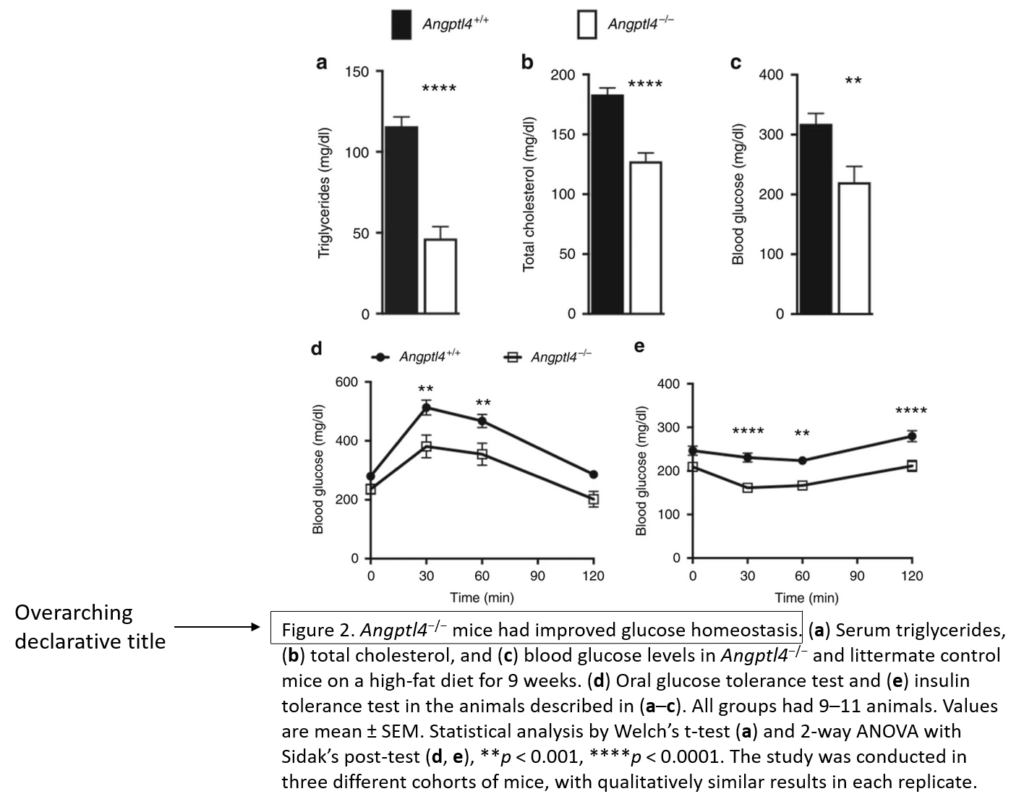
Ideally, each figure should answer only one question. You may have performed multiple independent experiments to answer one research question. The results of these independent experiments can be combined into a multi-panel figure, with one overarching declarative title.
 [1].
[1].
References
- Gusarova V, O’Dushlaine C, Teslovich TM, Benotti PN, Mirshahi T, Gottesman O, Van Hout CV, Murray MF, Mahajan A, Nielsen JB, Fritsche L. Genetic inactivation of ANGPTL4 improves glucose homeostasis and is associated with reduced risk of diabetes. Nature Communications. 2018 Jun 13;9(1):2252.
- Tan NY, Chew M, Tham YC, Nguyen QD, Yasuda M, Cheng CY, Wong TY, Sabanayagam C. Associations between sleep duration, sleep quality and diabetic retinopathy. PloS One. 2018 May 24;13(5):e0196399.
- Kroodsma DE. A quick fix for figure legends and table headings. The Auk. 2000 Oct 1;117(4):1081-3.
- Fancourt D, Steptoe A. The art of life and death: 14 year follow-up analyses of associations between arts engagement and mortality in the English Longitudinal Study of Ageing. BMJ. 2019 Dec 18;367.
